


Candlestick patterns are an essential part of technical analysis, offering traders a visual representation of price movements in the stock, forex, and cryptocurrency markets. These patterns, formed by sequences of candlesticks on a chart, reveal critical information about market sentiment and help traders make informed decisions. Whether you’re a beginner or an experienced trader, understanding candlestick patterns can significantly improve your trading strategies.
In this article, we’ll explore what candlestick patterns are, how they work, and discuss some of the most important patterns every trader should know.
What Are Candlestick Patterns?
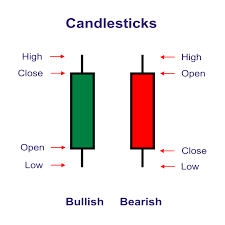
Candlestick patterns are formations made up of one or more candlesticks on a chart that indicate potential future price movements based on past trends. Each candlestick represents a specific time period (e.g., 1 minute, 5 minutes, 1 hour, 1 day) and consists of four key elements:
- Open Price: The price at the beginning of the time period.
- Close Price: The price at the end of the time period.
- High Price: The highest price reached during the time period.
- Low Price: The lowest price reached during the time period.
The body of the candlestick (the thick part) shows the difference between the opening and closing prices, while the wicks (the thin lines) represent the high and low prices.
Candlestick patterns can be categorized as bullish, bearish, or neutral, depending on the market sentiment they convey.
Key Bullish Candlestick Patterns
Bullish patterns signal a potential reversal from a downtrend to an uptrend. Here are some of the most reliable bullish candlestick patterns:
1. Hammer
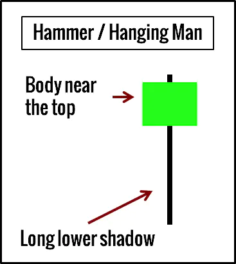
The hammer is a single candlestick pattern that indicates a reversal after a downtrend. It has a small body and a long lower wick, signifying that buyers are stepping in to push the price up after sellers drove it down. A hammer typically appears at the bottom of a downtrend and signals that a bullish reversal may be imminent.
2. Bullish Engulfing
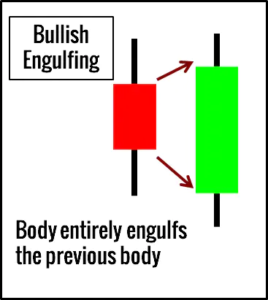
A bullish engulfing pattern consists of two candles: the first is a small bearish candle, followed by a larger bullish candle that completely engulfs the previous candle. This pattern suggests strong buying momentum, often signaling the end of a downtrend and the start of a potential uptrend.
3. Morning Star
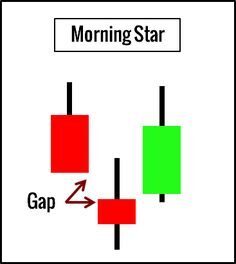
The morning star is a three-candle pattern that appears during a downtrend. It begins with a bearish candle, followed by a small candle that indicates indecision, and ends with a strong bullish candle. This pattern shows that the sellers are losing control, and buyers are taking over, potentially leading to a reversal.
Key Bearish Candlestick Patterns
Bearish patterns signal a potential reversal from an uptrend to a downtrend. Some important bearish candlestick patterns include:
1. Shooting Star
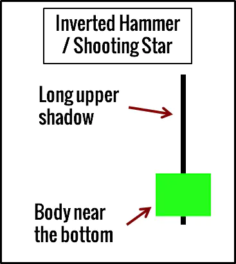
The shooting star is a single candlestick pattern that has a small body and a long upper wick, indicating that the price rose significantly during the session but fell back down by the close. This pattern suggests that buyers tried to push the price higher but were overwhelmed by sellers, signaling a potential reversal to the downside.
2. Bearish Engulfing
In a bear trend, sell below the bearish Engulfing pattern for bearish continuation.
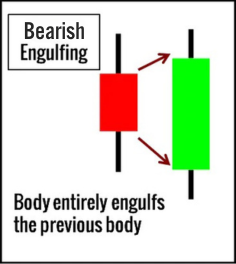
The bearish engulfing pattern is the opposite of the bullish engulfing pattern. It occurs when a small bullish candle is followed by a larger bearish candle that engulfs the previous one. This indicates strong selling pressure and suggests that the uptrend may be losing momentum.
3. Evening Star
A bearish candlestick that closes within the body of the first candlestick
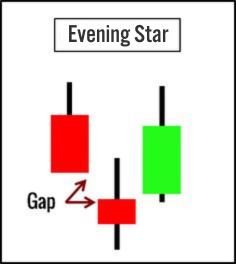
The evening star is a three-candle pattern that signals a bearish reversal. It starts with a strong bullish candle, followed by a small candle that indicates indecision, and ends with a bearish candle that confirms the shift in sentiment. This pattern often appears at the top of an uptrend.
How to Use Candlestick Patterns in Trading
To effectively use candlestick patterns in your trading, it’s essential to look for confirmation signals and combine them with other technical indicators. For example, if you spot a bullish engulfing pattern, you can wait for additional confirmation, such as a breakout above a key resistance level or an increase in trading volume, before entering a trade.
Here are a few tips for incorporating candlestick patterns into your trading strategy:
- Combine with Support and Resistance: Candlestick patterns are more reliable when they occur near support or resistance levels.
- Use in Conjunction with Other Indicators: Indicators like moving averages, RSI (Relative Strength Index), and MACD (Moving Average Convergence Divergence) can help confirm candlestick signals.
- Practice on Demo Accounts: Before risking real money, practice identifying and trading candlestick patterns on a demo account.
Conclusion
Candlestick patterns offer traders a simple yet powerful tool for analyzing market sentiment and predicting future price movements. By mastering key patterns like the hammer, bullish engulfing, shooting star, and evening star, traders can enhance their decision-making and improve their trading outcomes.
However, it’s essential to remember that no pattern is foolproof. Always combine candlestick analysis with other technical tools, fundamental analysis, and risk management strategies to maximize success in the market.